

Peter Drucker once said, “If you can’t measure it, you can’t improve it.” That applies to happiness just as much as to the quality of automobiles that Toyota is producing. If you want to be happier, a good place to start is to make objective just how happy you are now.
This takes some work. There is no such thing as a happiness sensor that gives you an automatic readout on your happiness level. Happiness is not a transient emotional state. As I wrote in “A Fuller Concept of Happiness,”
[H]appiness is durable and ongoing. It is a positive state that you return to after any ups and downs. When the euphoria wears off, you still feel good rather than let down. Despite getting terrible news that throws you for a short time, you bounce back and have composure. You may hit every red light on the the way to work, but that doesn’t kill your mood for the day.
To some degree, happiness is a numbers game. If you feel miserable for two hours in a day, it was not a happy day. If you had two bad days in a week, it was not a happy week. To be in a state of happiness, the positive experience needs to endure most of the time — say, 80-90% of the time.
This durable positive experience is possible because happiness concerns achieving not “a goal” but “one’s values.” Happiness is not an isolated bright spot, it’s a glow throughout your life. To put it more technically, it is a generalized state of positive affect. (“Affect” refers to the pleasantness or unpleasantness of any experience.)
This means that measuring happiness is not as simple as introspecting the intensity of your positive (or negative) feelings, though that is a part of it. Measuring your happiness requires looking at the ups and downs of your affect across a specific period of time. By my reckoning, there are three kinds of factors to gauge.
One day’s emotional readout
The moment-by-moment intensity of your positive or negative affect is obviously a contributor to your happiness. So as a starting point, draw an approximate graph of your emotional ups and downs across yesterday. It’s not possible to put absolute numbers on that, but you can certainly judge whether you feel satisfaction, joy or ecstasy (above the line, in the happiness range), versus serenity (at the transition or zero line), versus ambivalence, frustration, or distress (below the line in some kind of internal conflict and therefore suffering).
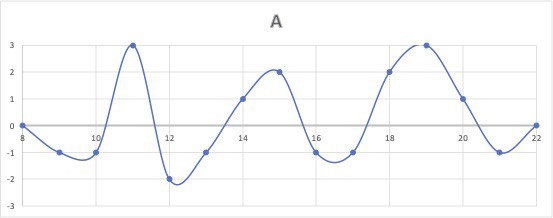
Let’s stipulate Person A’s emotional readouts yesterday between 8:00 a.m. and 10:00 p.m. graphed like this:
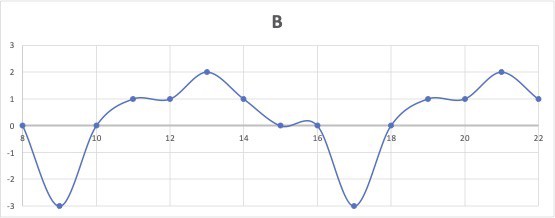
And Person B’s emotions graphed like this over the course of the day:
In these graphs, the zero line is a state of serenity. Remember that serenity can include sadness and relief and indifference — a number of quiet emotions. Everything above the zero line is emotions that constitute happy periods — unconflicted joy, pride, confidence, gratitude. Everything below the line includes the negative threat-oriented emotions such as anger, fear, and guilt, plus all of the conflicted states such as ambivalence that constitute mild forms of suffering.
How do you make sense of the graphs?
Who is happier? A has higher highs, but B spends less time in his lows. My engineering training comes in handy to make sense of this. We need to pull out some objective metrics to characterize their happiness.
Here are the four statistics* I’d take straight from data in this graph:
- Highest high
- Lowest low
- Mode (most common state)
- Median (state at which half the measurements are above, half below)
Obviously, you’d like the highest “high” to be higher rather than lower. On this measure, A is doing better than B, with his max of +3 rather than +2. He’s also doing better in that he has a less low “low” — only a -2 to B’s -3. In some respects, B is having a tougher time right now than A.
But the picture changes when we look at the mode and median. B’s most common state is +1 whereas A’s most common state is -1! And B’s median is in the happy range (+1), which means the preponderance of his time is spent in the happiness range. In contrast, A’s median is at 0, meaning A spends roughly equal time happy as suffering.
The purpose here is not to compare A and B’s happiness, but rather to show some things you could spot about your own degree of happiness by tracking your emotional outputs on a daily basis.
If you collected this data for a few weeks, you would get a good idea of your peak happiness, worst suffering, and your day-to-day typical happiness level. Depending on which aspect you wanted to improve, you would enact different causes. For example, if you wanted to increase the amount of time you spent solidly in the mid-range of happiness, you might want to strengthen and integrate your values, to add more meaning to your life. You could do this by developing a central purpose. Or if you wanted to mitigate the lows, you might decide to learn more about how to accept reality to get to a state of serenity.
Durability of the highs versus lows
The durability of the highs and lows also matters. In the charts above, you can see that Person A appears more volatile than Person B. A goes from a high to a low and back about twice as often as B. This in itself could just be a factor of the environment. If A is in a high-pressure job, issues could come up frequently — and he’d expect to have a lot of ups and downs every day. In contrast, B might be in a very quiet environment where there aren’t many stressors, but is grieving a lost loved one. His downs are caused by periodic bouts of despondency.
In my view, the real key to long-term happiness is how much time you spend in serenity or above the line in happiness, rather than below the line in suffering. We need a name for this. I have been calling it your “baseline happiness,” measured as a percentage. What overall percentage of your waking time are you in a good emotional state? For A and B you can graph it as follows, if we assign a simple +1 or -1 to each hour of the day:
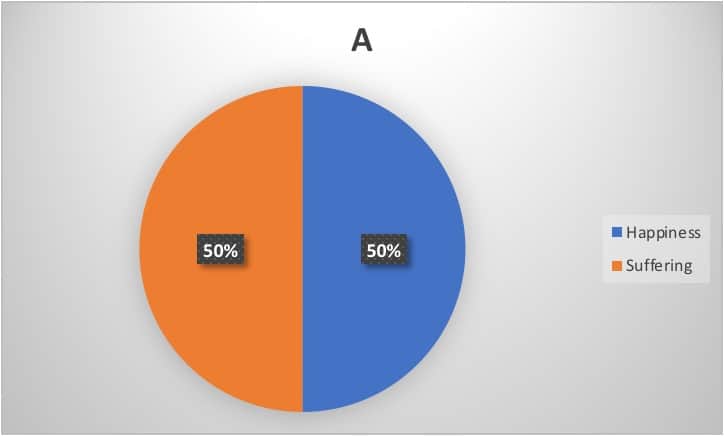
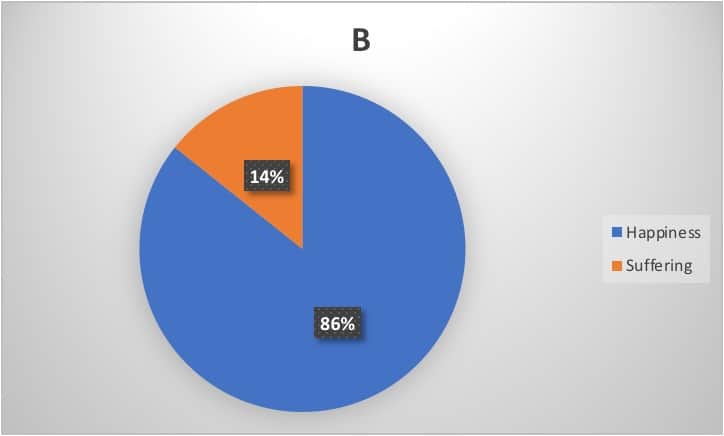
On this measure, B is doing better, spending approximately 86% of his time up, to A’s 50%.
If you wanted to increase your baseline percentage, the place to look is your standard operating procedures. By “standard operating procedures,” I mean the habits, processes, and systems you have developed for gaining and keeping values in your life.
For example, you probably have sleep and wake-up routines. These keep you reasonably clean and groomed and rested. If you’ve had to go without showers or sleep at times, you know this is important to your level of happiness! But for most people, most of the time, these routines don’t get a lot of thought. They are the default. Barring emergencies or unusual circumstances, these parts of life keep going just fine.
But sometimes there are areas of life that are routinely causing trouble. Sometimes the best way to improve your baseline happiness is to develop a system that ensures certain kinds of values are gained easily every day. For example, sometimes people need to put in place a scheduling infrastructure to keep them from spending all of their time fighting fires of their own making. In other cases, they need to start doing daily thought work to ensure they are consistently motivated to work on their top priorities. Many people find that adding a daily practice to focus on values more, such as “Three Good Things,” makes a noticeable difference in their baseline happiness.
If you want a metric to help you gauge your happiness level, ask yourself how much time you typically spend down relative to the time you spend up? The baseline happiness is worth identifying, and improving via new systems, if it’s below about 80%.
Speed of recovery
The final metric I recommend you look at is speed of recovery. Bad stuff can happen in an instant due to factors outside of your control. But how you deal with that bad stuff is a result of your efforts to get back to your baseline level of happiness. In the two graphs, I made Person A take longer to recover than Person B. Person A usually took a couple of hours to get back up, whereas Person B bounced back immediately.
It’s possible to reduce this recovery time. For example, I used to need 30 minutes to calm down after getting angry. At some point I noticed two things. First, my husband calmed down much more quickly. Second, I was caught up in a thinking loop that was re-energizing the anger. I put my mind to breaking that loop, sooner rather than later, and got my recovery time down to 5 minutes. That was a significant improvement in my quality of life.
What makes the difference here is your emotional resilience and skill at self-direction. “Emotional resilience” is the ability to bounce back from emotional upheaval. You may have a moment of despair, but you recover quickly. Your buttons may be pushed, but you are able to be curious about your reaction and refocus on values. You need emotional resilience, because otherwise the painful emotions involved in a bad experience can suck you into a vicious cycle of suffering. In extreme cases, they can suck you into a bout of depression.
However, pausing isn’t enough. “Self-direction” is the process of aligning reason and emotion in order to take rational steps. It consists of three essentials: setting a rational purpose, activating desire to take the steps, and rejecting any threat-oriented status quo that holds you back from taking them. It is by taking rational steps, which actually achieve values, that you then regain the joy in your life.
Emotional resilience and self-direction are both learnable skills that I discuss at length in the Thinking Lab and Launch programs.
The bottom line? Happiness is complex, but if you look at your affect across time, you can identify useful metrics to help you gauge what is working well in your life and where some new skills could significantly raise your baseline level of happiness.
*Incidentally, it makes no sense to take an average of these numbers. These rankings are qualitative, not quantitative, so there is no reason to believe that a joy of 3 is 3x as good as a joy of 1. 1 is good, 2 is better, 3 is best. (And for the negative numbers, it’s bad, worse, and worst.) I’d also argue that a 3 high doesn’t balance a -3 low — the latter is much worse. If you haven’t already read How to Lie with Statistics by Darrell Huff, I encourage you to do so. In this day and age, you need to know something about statistics to spot when they are being misused.


0 Comments